- Petrolink
- Visualization
Visualization
Visualize Operations with Clarity and Precision
Deliver complex data through intuitive, interactive dashboards — enabling faster interpretation, real-time collaboration, and smarter decision-making from the rig to the office.
Visualization Applications
PetroVue ™
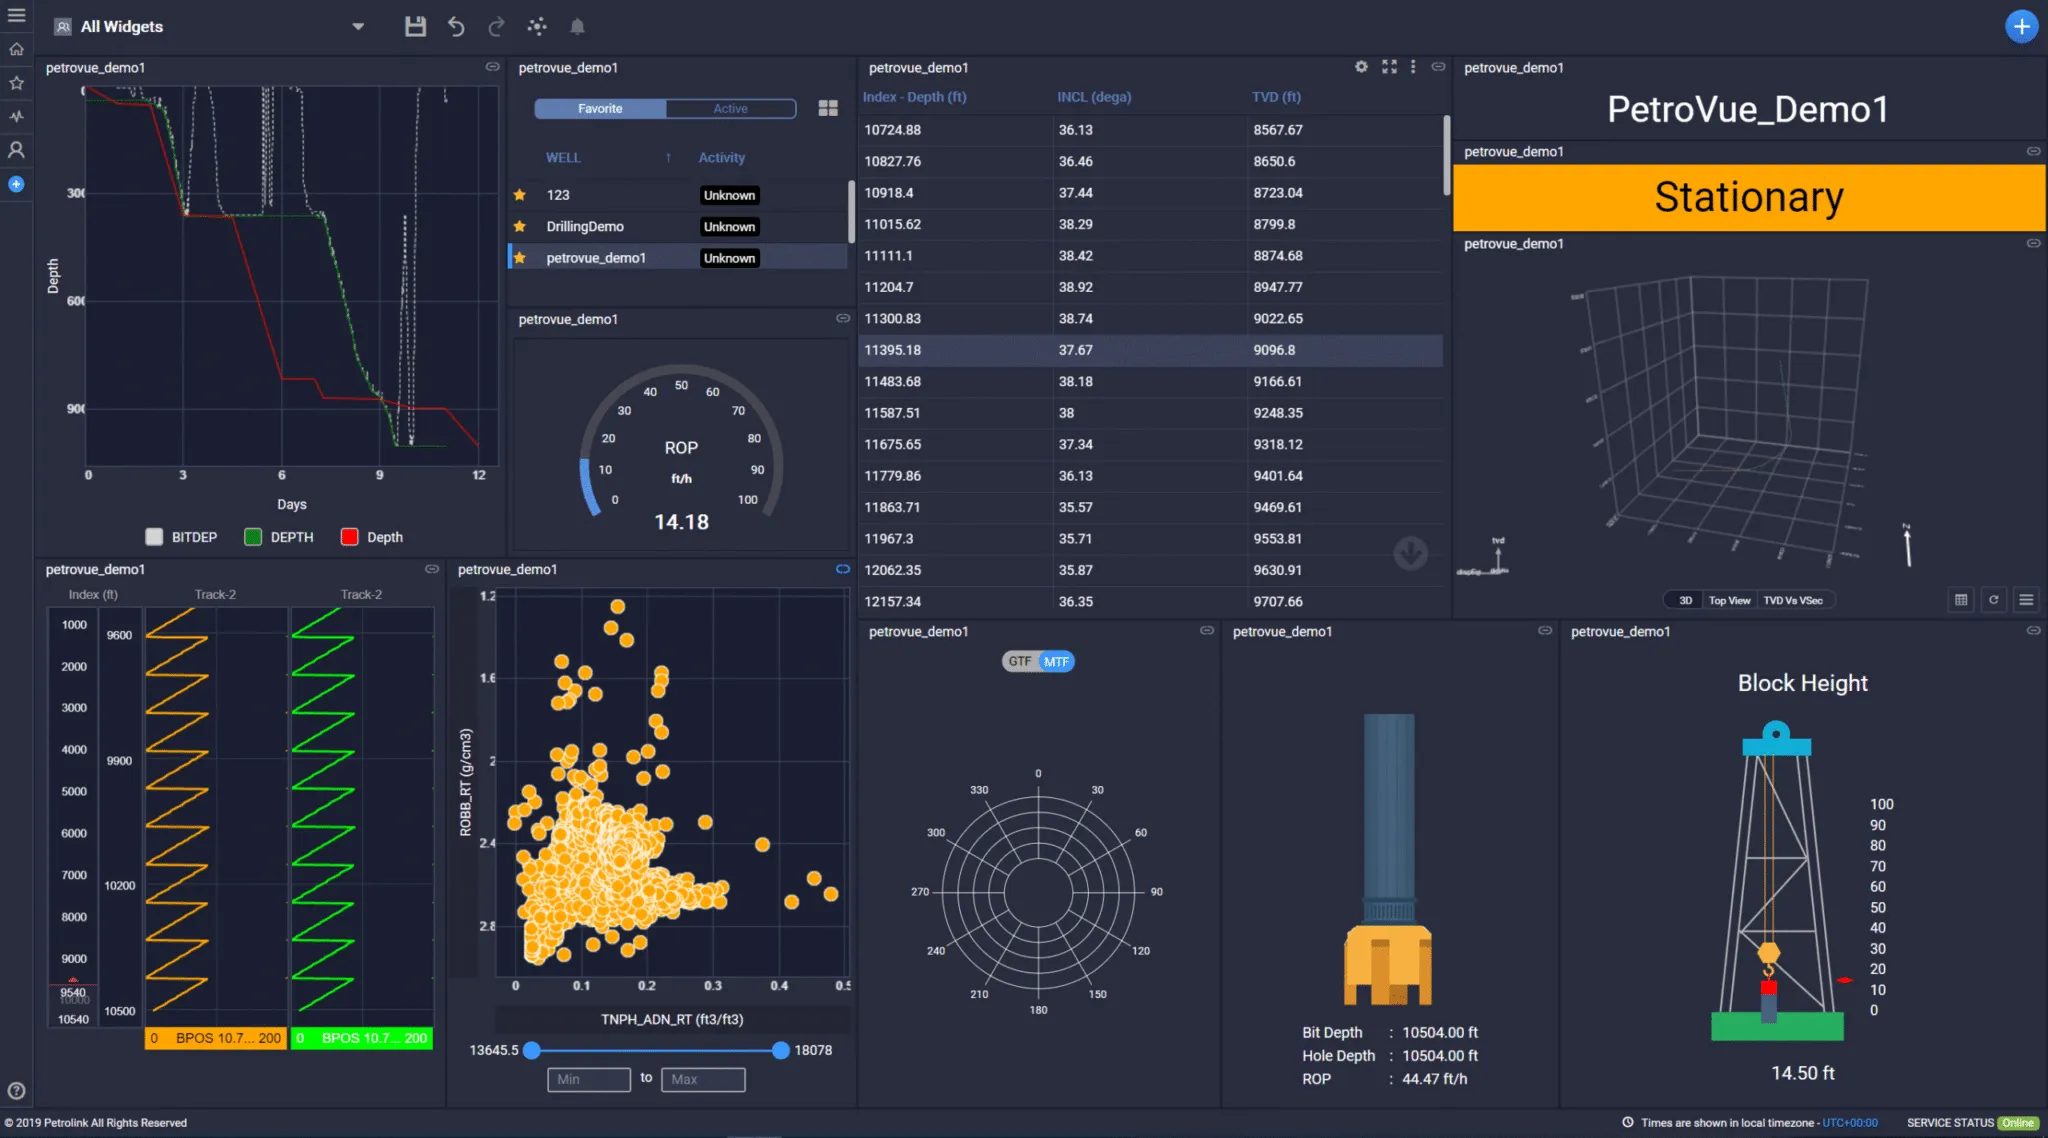
PetroVue transforms real-time wellsite monitoring by centralizing global operations into a single, lightweight, web-based platform. It enables drilling engineers, geologists, and subsurface teams to remotely oversee multiple wells, collaborate effectively, and guide onsite personnel in real-time. With customizable, high-performance displays, PetroVue improves operational efficiency, and helps teams proactively manage drilling risks.
-
Real-time data monitoring with mobile access for field and remote teams.
-
Streamlined wellsite reporting and file sharing for faster collaboration.
-
Real-time alerts and exception tracking to reduce operational risk.
-
Data-driven insights for optimizing rig performance.
-
Flexible platform with customizable high-performance displays.
-
Simplified WITSML data management and advanced well correlation.
-
Customizable templates and user-friendly widgets simplify complex data visualization.
-
Easily build, share, and collaborate on templates across teams.
-
Multi-tab views sync data across widgets for better insights.
-
Set threshold alarms and export data in various formats.
PetroVue for Drilling
Discover powerful applications that make drilling management simple and effective.
Real-time Well Monitoring
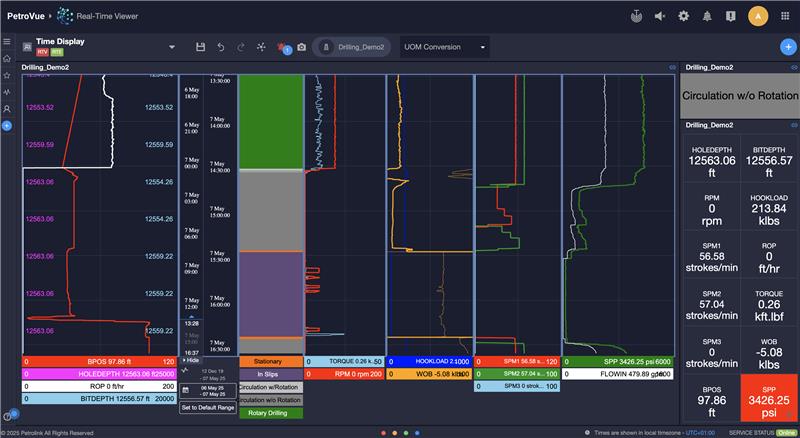
PetroVue provides real-time visibility into key surface parameters, helping engineers make informed, timely decisions to maintain safe and efficient operations. With customizable displays, engineers can track surface parameters such as weight on bit, torque, rate of penetration, and pump pressure alongside downhole data — all in one unified view.
-
Real-time monitoring of critical surface and downhole parameters.
-
Customizable dashboards for rig-specific and operation-specific views.
-
Easily access and download surface and tool data.
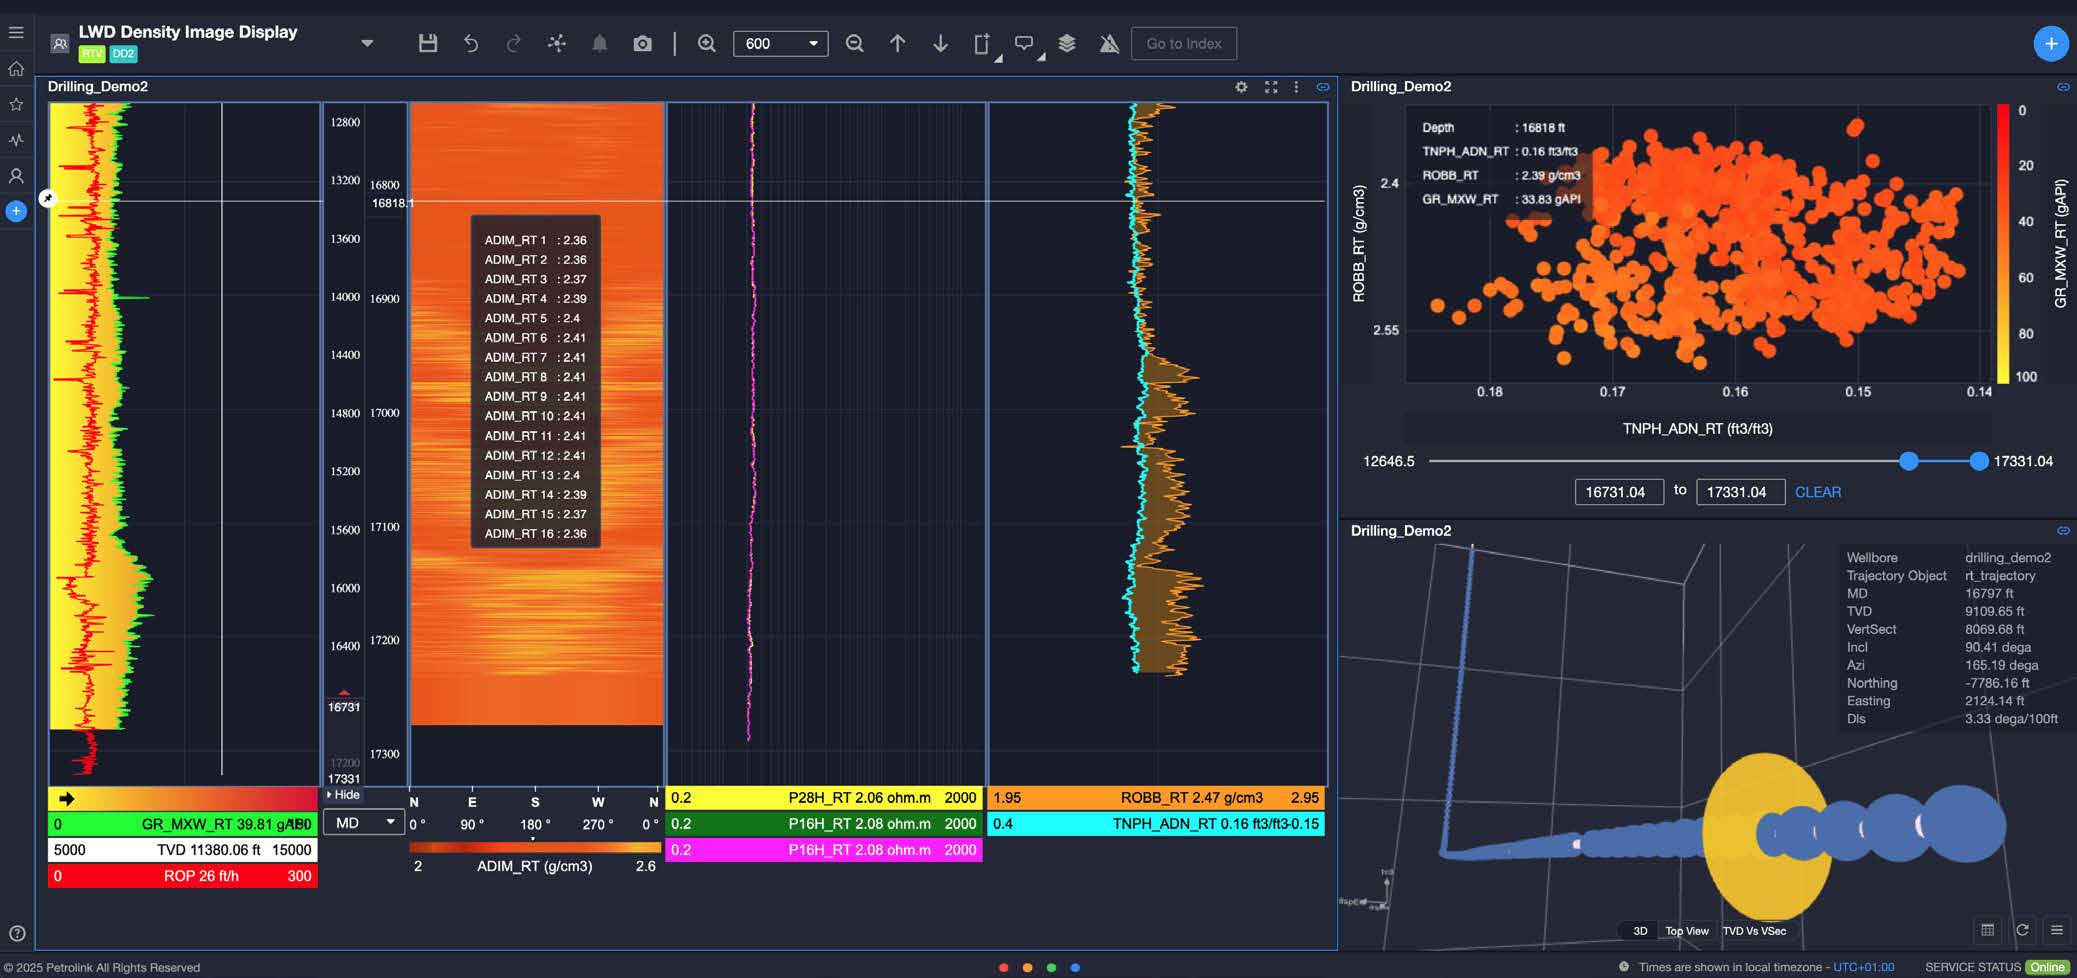
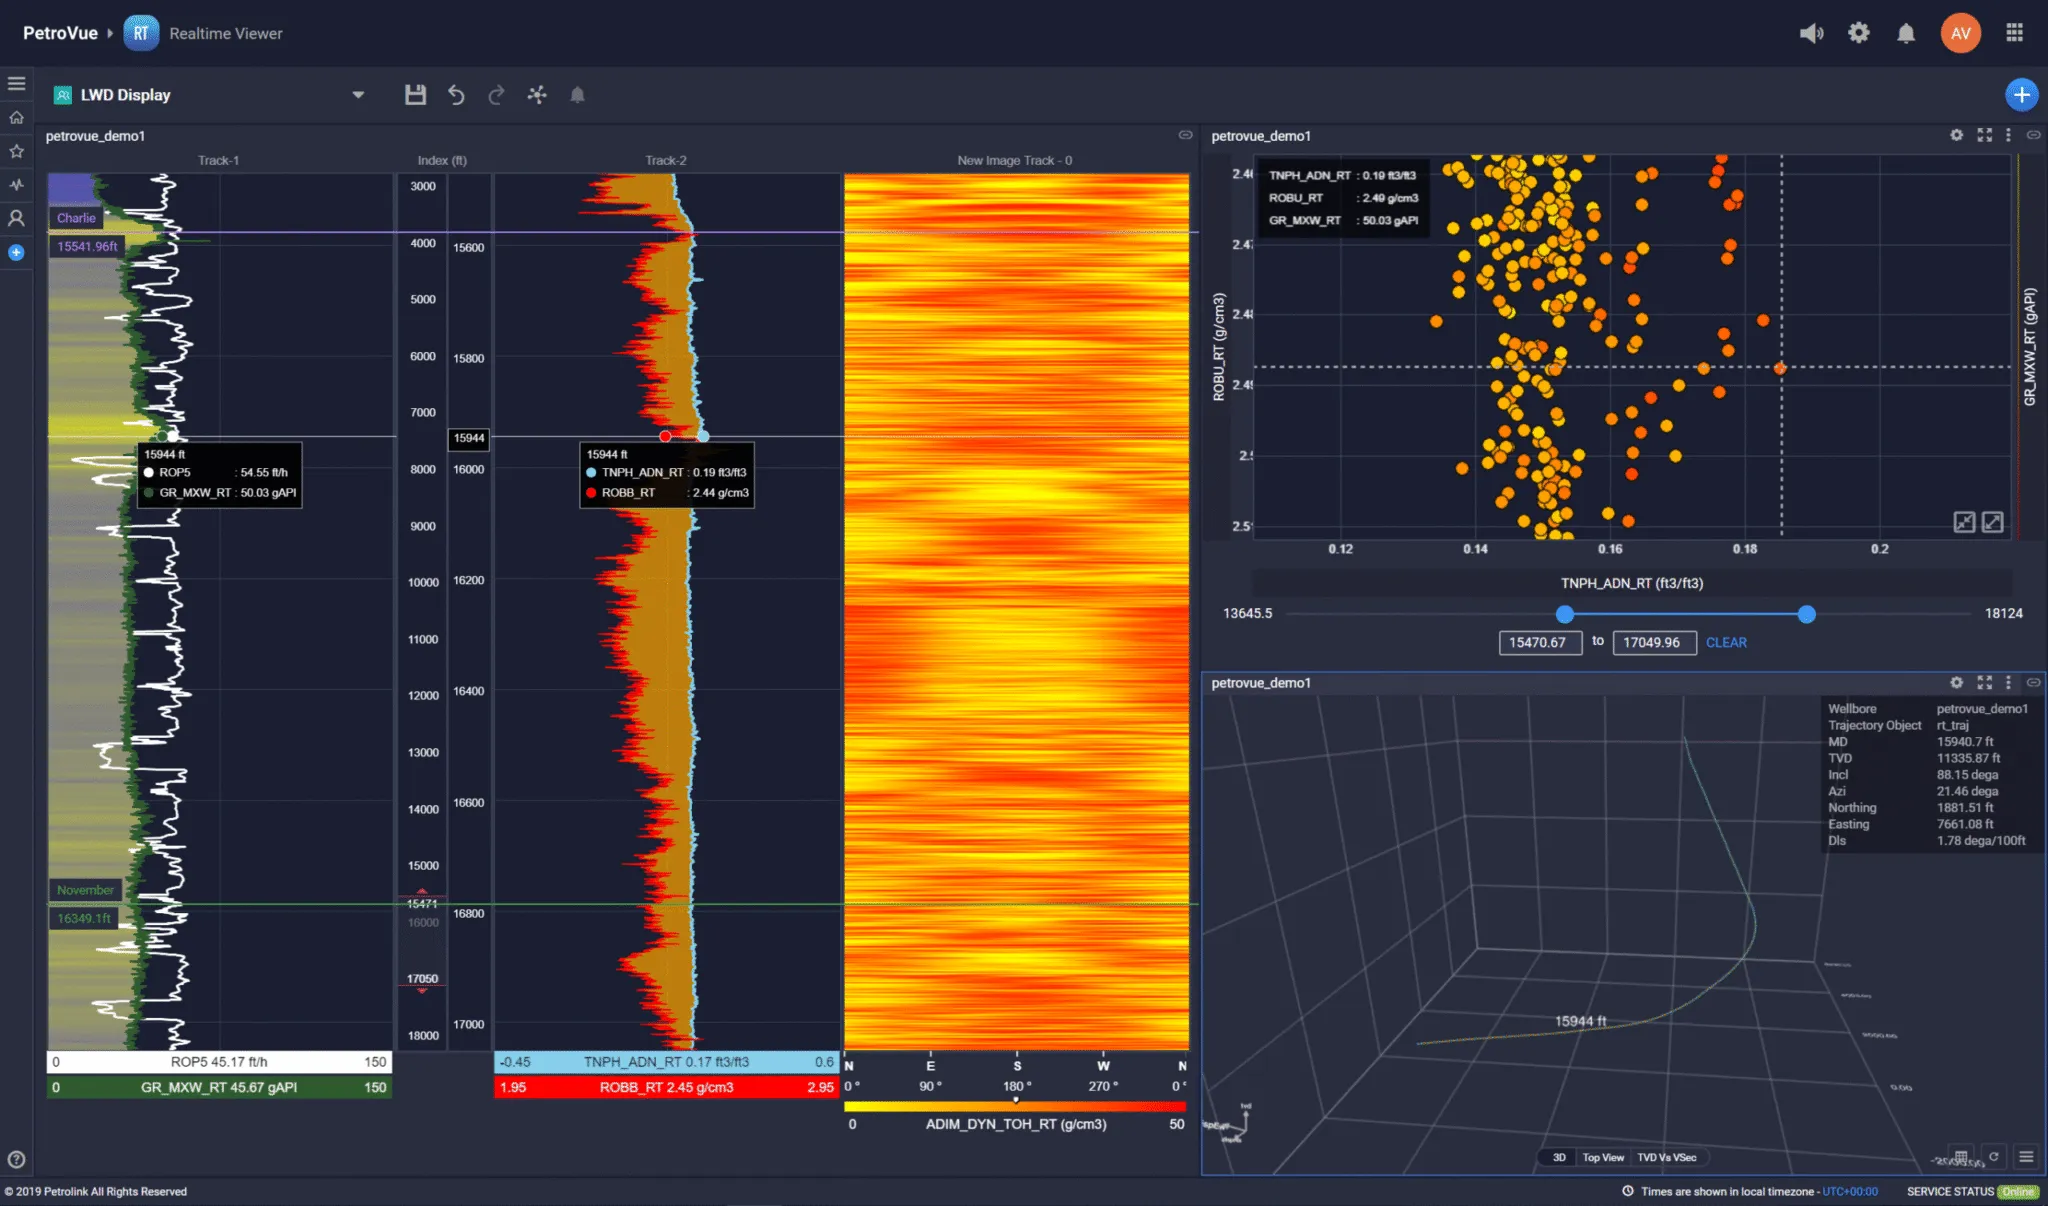
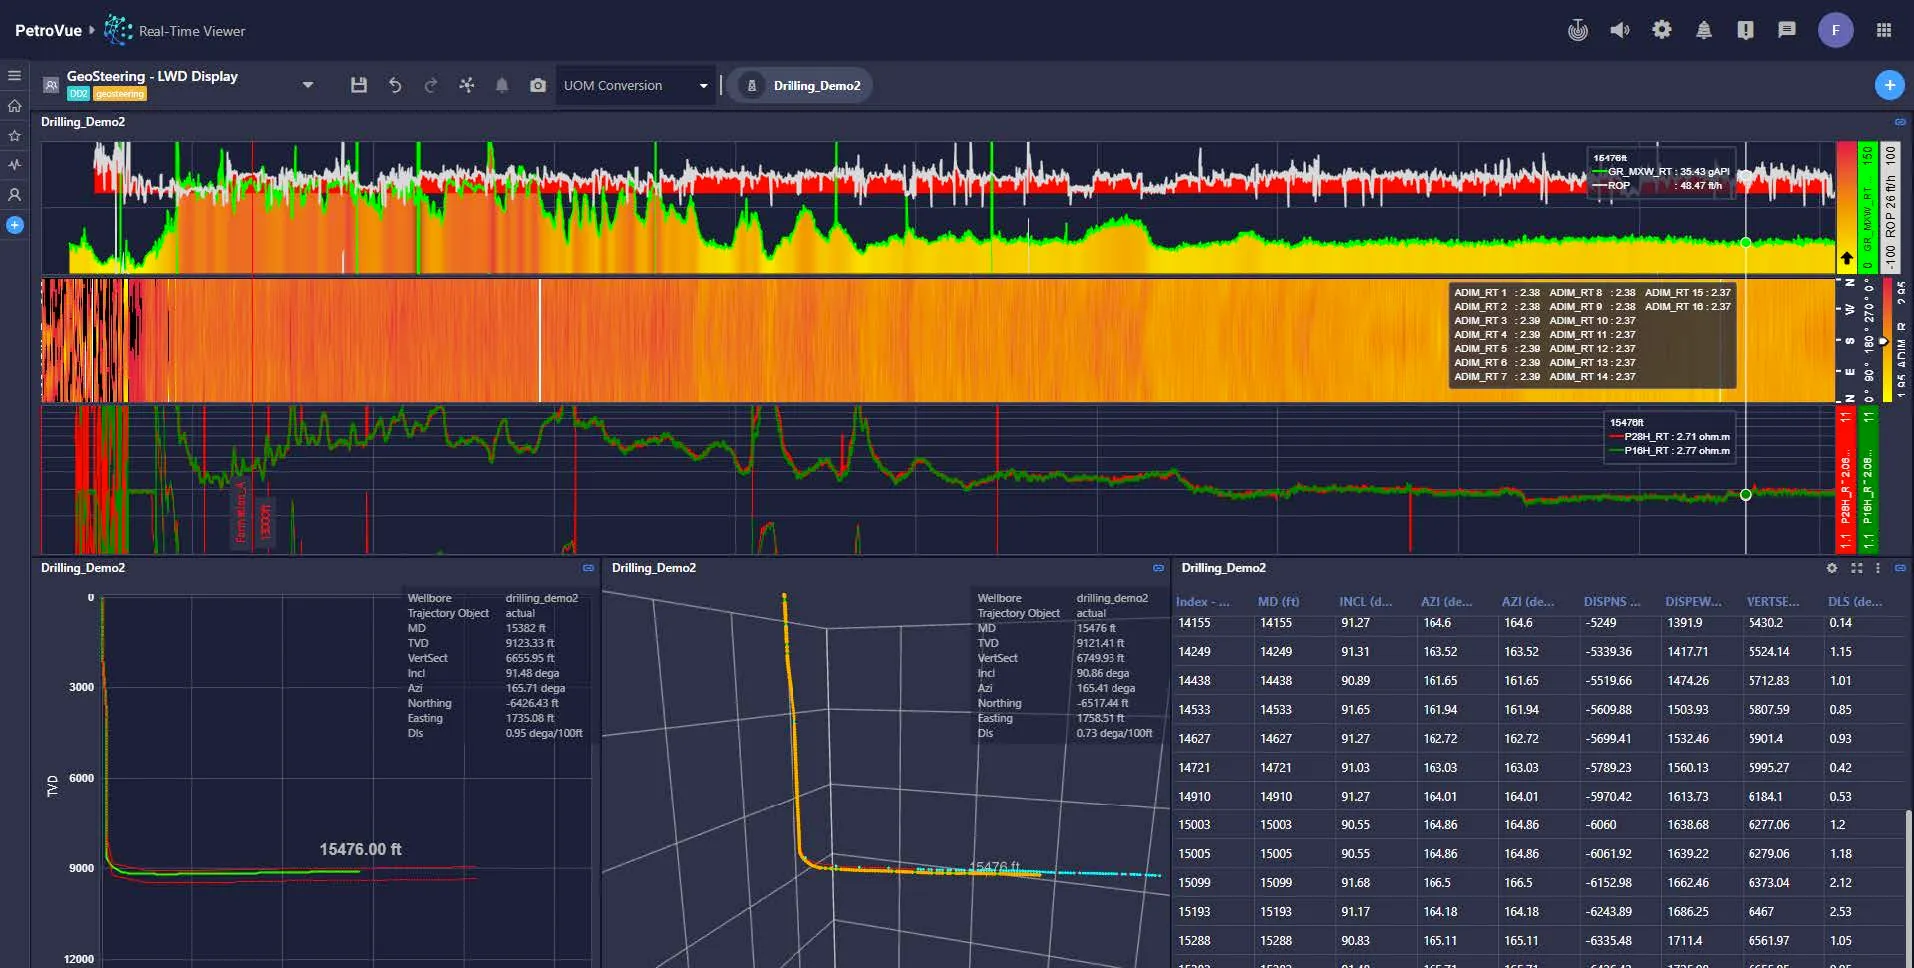
Logging While Drilling
PetroVue enables drilling engineers to build customizable LWD displays for real-time subsurface insights – helping steer accurately, avoid hazards, and reduce sidetracks. With a web-based, customizable interface, it enables real-time oversight and collaboration — keeping drilling efficient and uninterrupted.
-
Identify shale and hydrocarbons using gamma, neutron, and density crossover data.
-
Monitor fractures and formation variation with density, resistivity, and imaging tools.
-
Dynamic and static tooltips provide precise, point-specific insights.
-
Customizable, shareable templates enhance visualization and collaboration.
-
Boosts geosteering accuracy and well landing efficiency.
Virtual Geosteering
Support geosteering operations and ensure optimal well placement. Access real-time drilling and geological data, enabling shared visibility into trajectory and formation data. This lightweight solution allows for collaboration between onshore and offshore crews.
-
Visualize active and historical wells in 3D, top, and cross-section views.
-
Track predicted survey points and real-time well trajectories.
-
Collaborate seamlessly across teams during geosteering operations.
-
Mark formation tops and overlay pay zones for better targeting.
-
Use risk objects to capture, share, and track potential operational risks.
-
Measure apparent and true dip angles while drilling.
-
Correlate LWD data with trajectory changes using the geosteering dashboard.
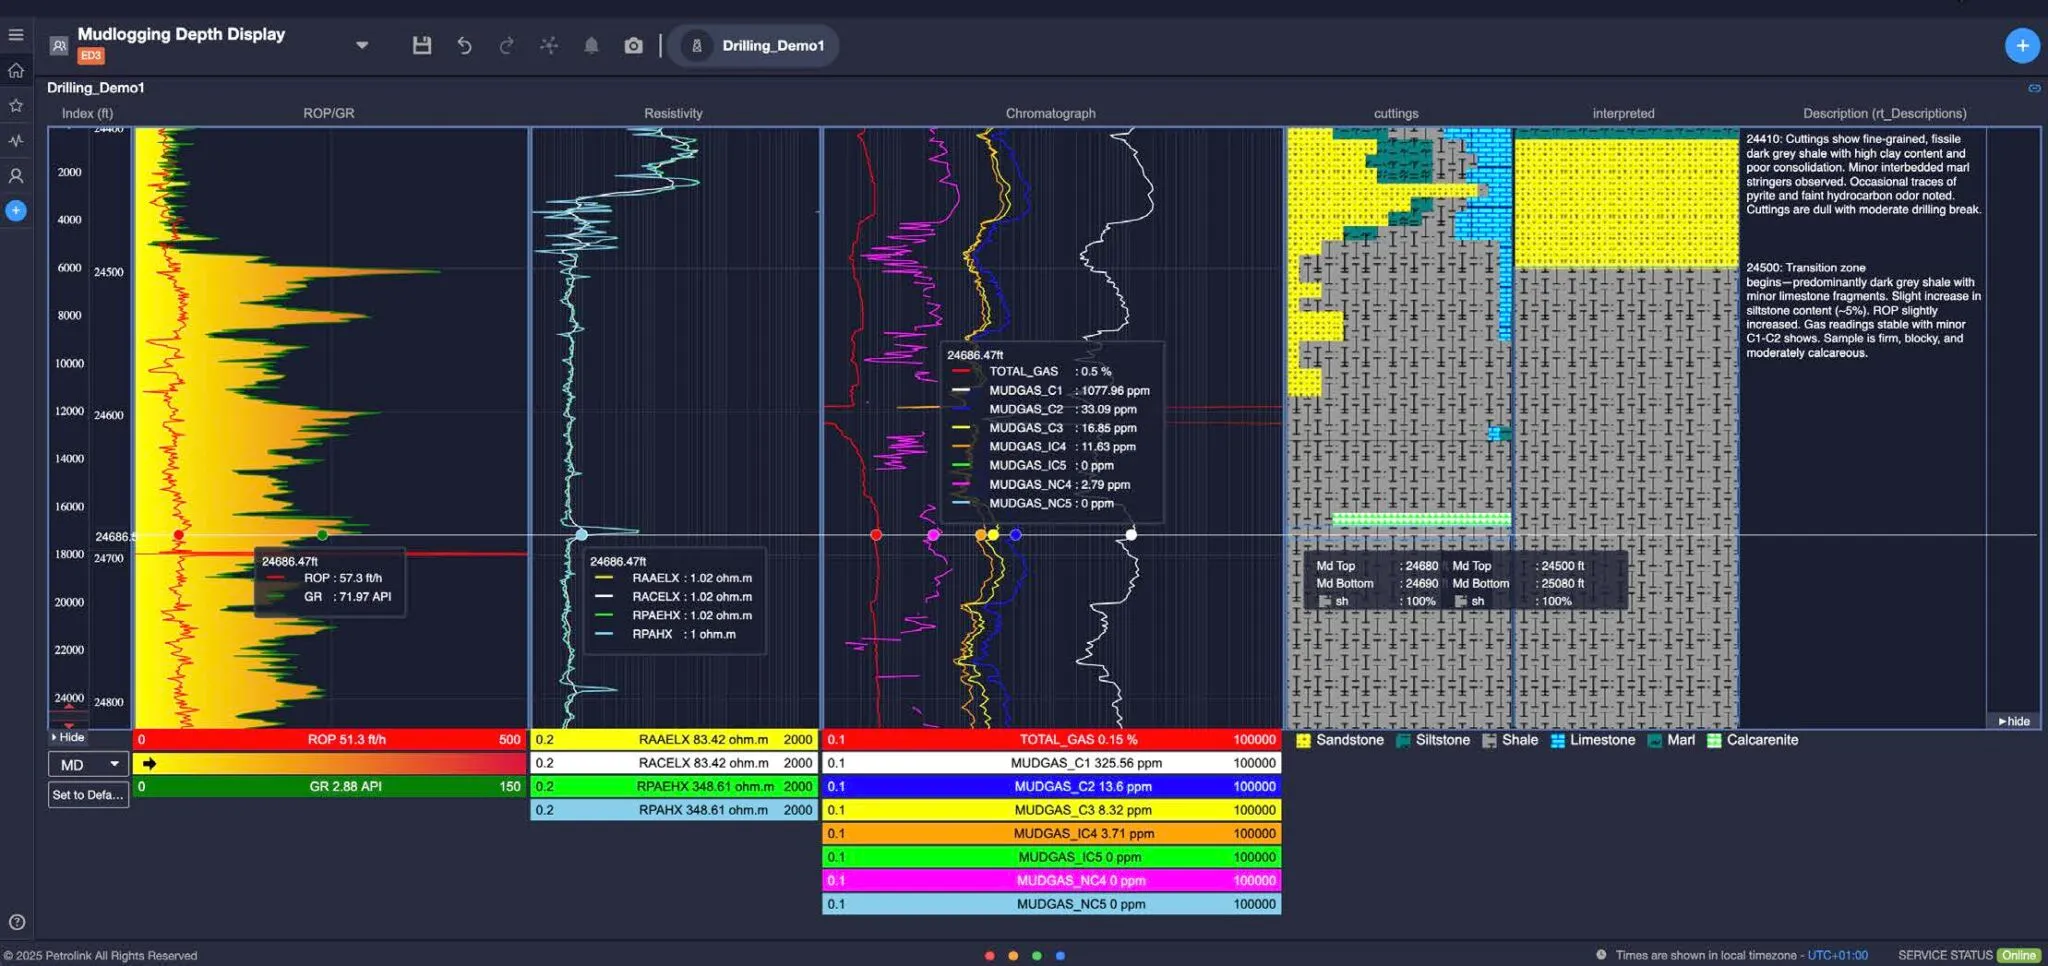
Mudlogging
Gain real-time surface insights into formation gases and cuttings to identify hydrocarbon zones early and reduce drilling risks.
A customizable interface that integrates gas composition, lithology, and drilling parameters. Supports faster, safer decisions for formation evaluation and well control, while a clear, interactive log display enhances geological interpretation and collaboration.
-
Compare lithology, mudlogging, and LWD data in a single view.
-
Plot cuttings and interpreted lithology with depth-tagged, real-time comments.
-
Use tooltips to identify key data points and highlight critical well events.
-
Update lithology information directly from the dashboard.
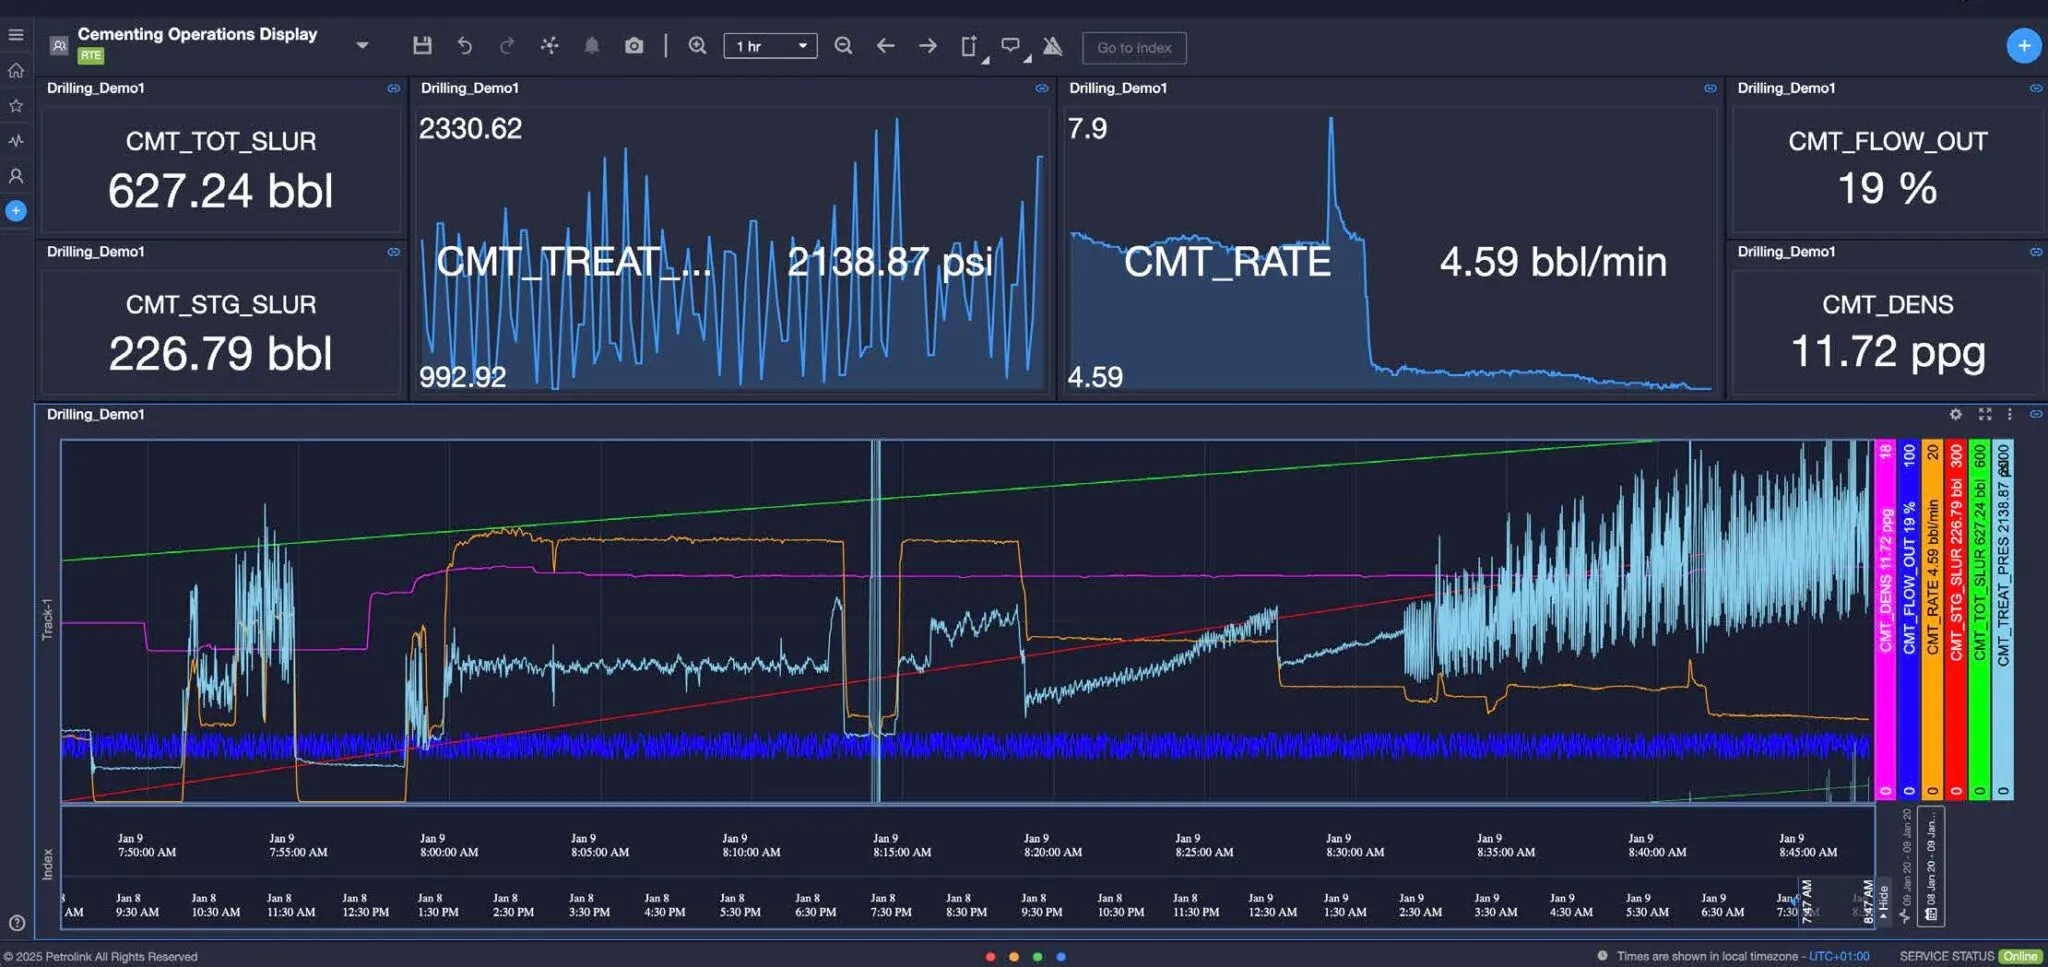
Cementing Overview
Gain real-time visibility into pressure, flow, volume, and displacement to ensure accurate cement placement and long-term well integrity.
A customizable, web-based interface enhances collaboration across drilling, cementing, and subsurface teams, reduces non-productive time, and simplifies post-job analysis for
greater job success.
-
Monitor cement slurry density, pressure, flow, and displacement in real-time.
-
Alerts for critical deviations ensure timely response.
-
Event tagging and annotations for identifying key cementing milestones.
PetroVue for Completion and Production
Applications for every stage.
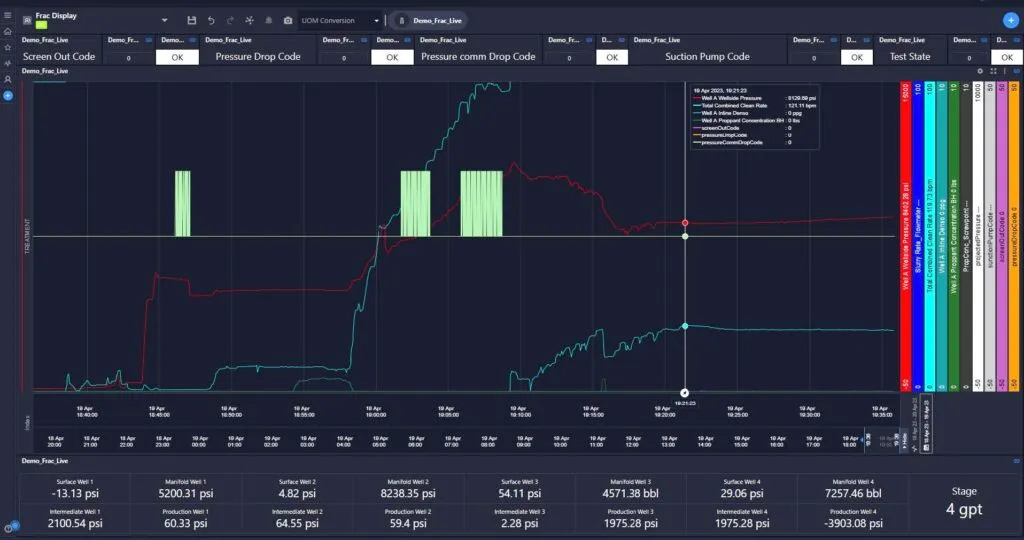
Fracturing Logs
The Fracturing Logs display gives completion engineers real-time insight into fluid volumes, pressure trends, and formation response during fracturing operation. With fast performance and customizable visualizations, it helps teams optimize each stage, minimize inefficiencies, and collaborate effortlessly across multiple wellsites.
-
Integrate caliper data to identify breakouts and wellbore stability issues.
-
Evaluate rock properties, pore size and hydrocarbon presence.
-
Integrate with real-time widgets for a complete well overview.
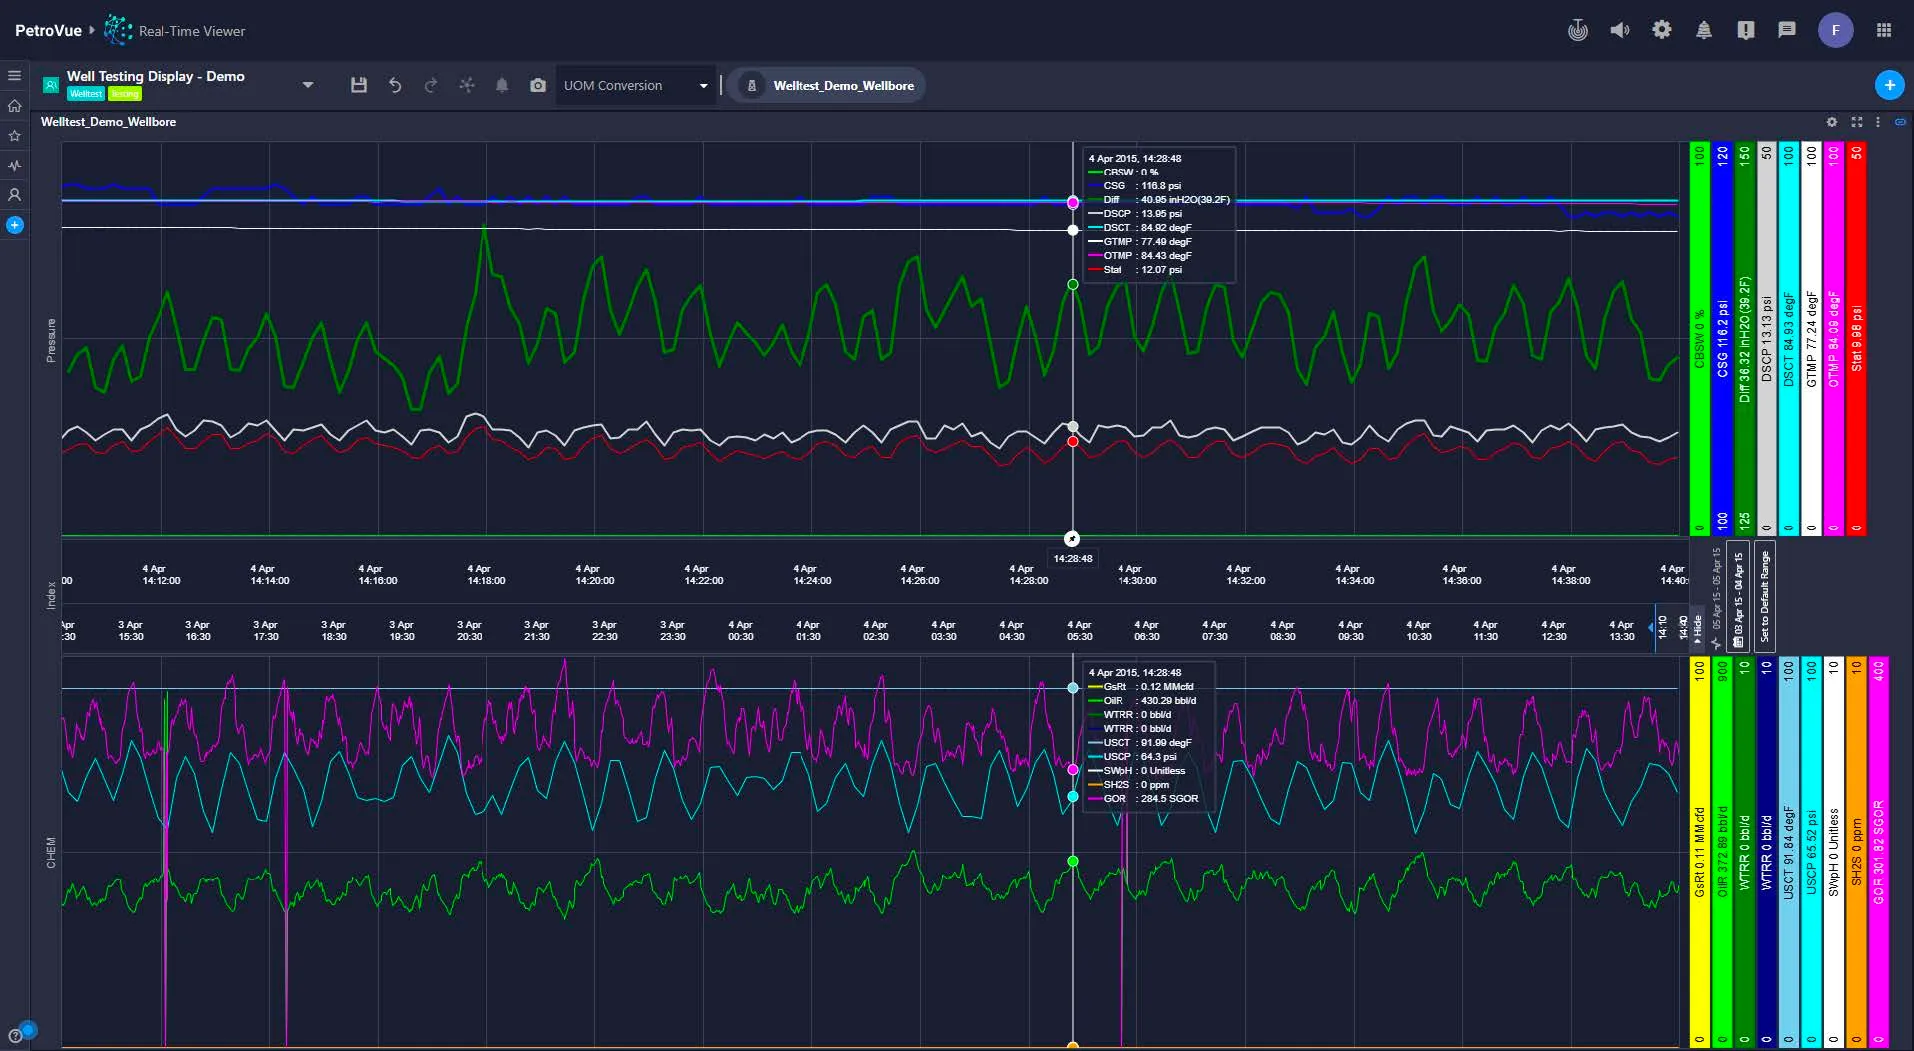
Well Testing and Production Logs
The Well Testing and Production Logs display provides production engineers with real-time, zone-by-zone insights into fluid flow and well performance — enabling rapid diagnosis of issues like gas or water breakthrough and validation of completion strategies.
-
Monitor real-time production, pressure, and temperature with intuitive gauges and widgets.
-
Combine production and artificial lift data in a single, interactive display.
-
Add real-time annotations and receive alerts on parameter changes.
-
Identify underperforming wells to reduce downtime and boost output.
-
Centralize production and test data to streamline workflows and improve forecasting.
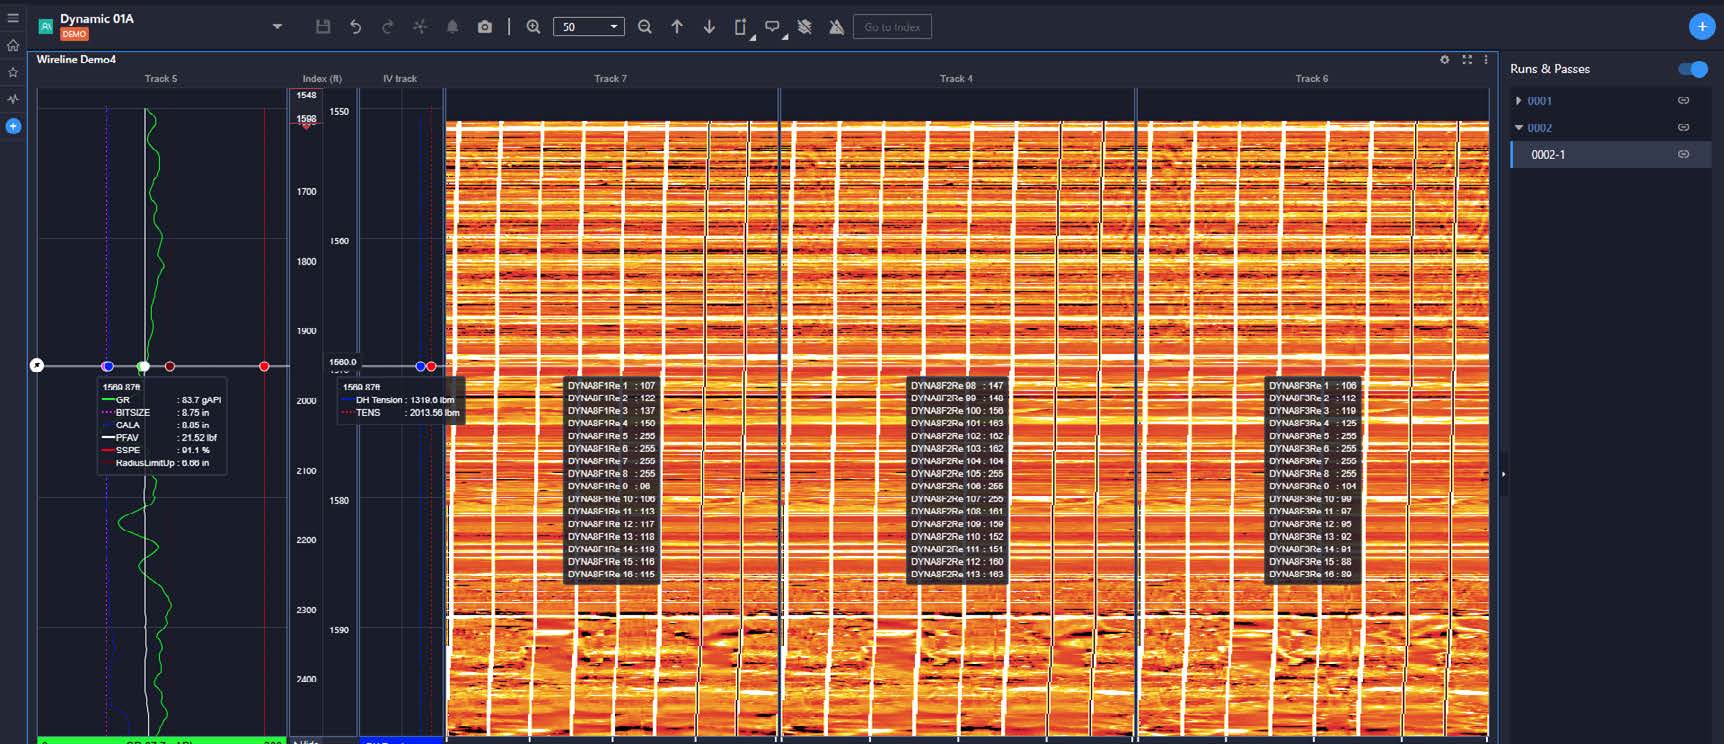
PetroVue for Wireline ™
Discover powerful applications for wireline operations.
PetroVue for Wireline
PetroVue Wireline provides real-time, high-fidelity visualization of downhole log data — including triple-combo, Cement Bond Logs (CBL), and Nuclear Magnetic Resonance (NMR) — helping petrophysicists and geologists quickly assess formation quality and wellbore integrity. The collaborative web interface streamlines decision-making across well completion, stimulation, and abandonment operations.
-
Compare Wireline and MWD/LWD logs to detect borehole changes.
-
Integrate caliper data to identify breakouts and wellbore stability issues.
-
Evaluate rock properties, pore size, and hydrocarbon presence.
-
Display log up/down passes and split logs for detailed analysis.
-
Integrate with real-time widgets for a complete well overview.
-
Support sample recovery and casing collar location.
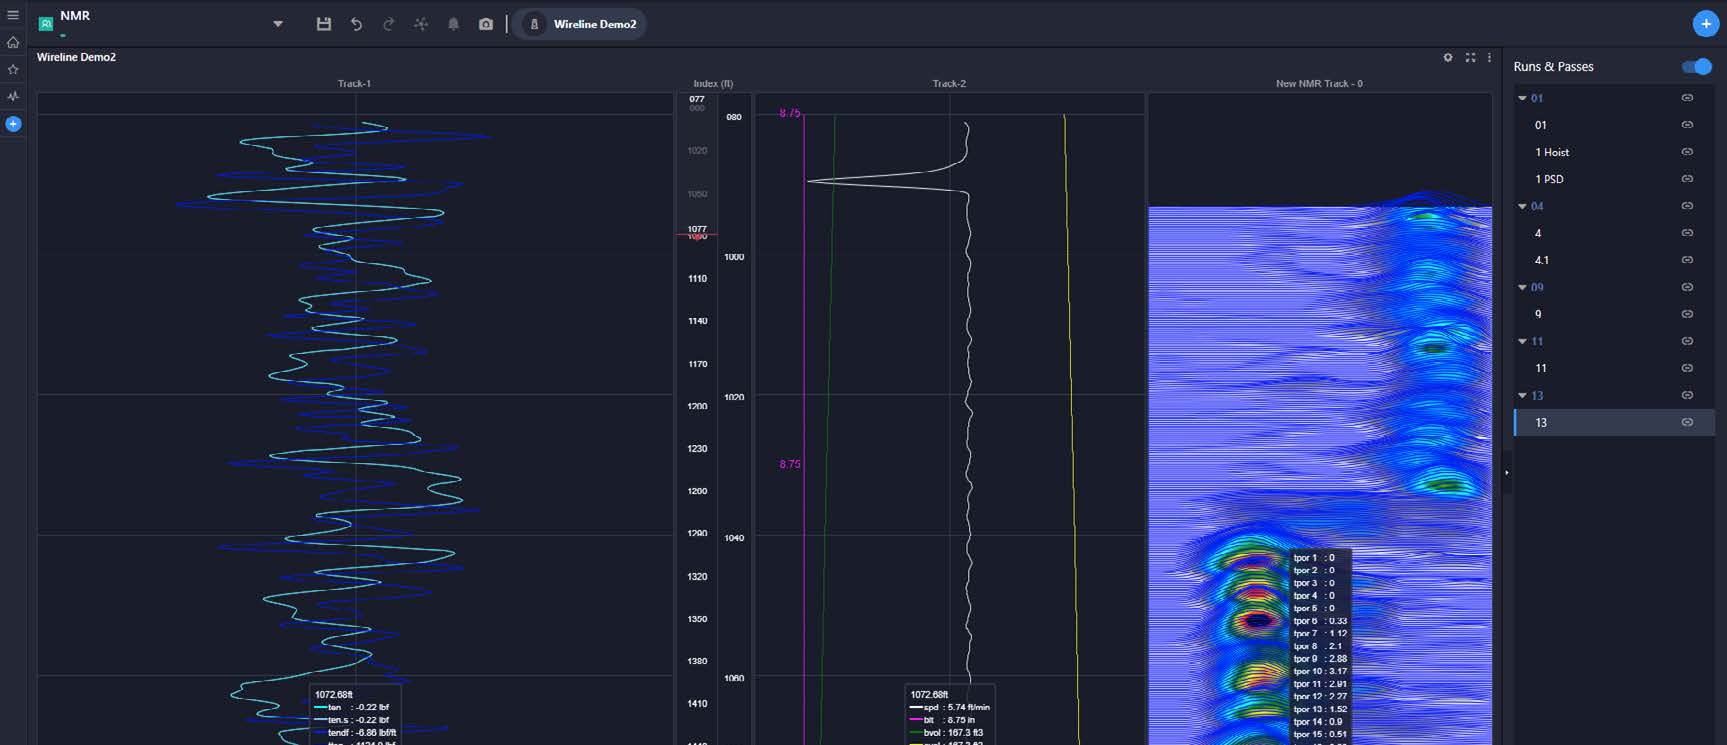
Nuclear Magnetic Resonance
The Nuclear Magnetic Resonance (NMR) display equips petrophysicists with real-time, high-resolution NMR data in a customizable web interface. By visualizing pore fluid properties alongside other downhole parameters, it enables a clear distinction between producible and non-producible fluids, streamlining formation evaluation, and guiding more efficient, cost-effective well completions.
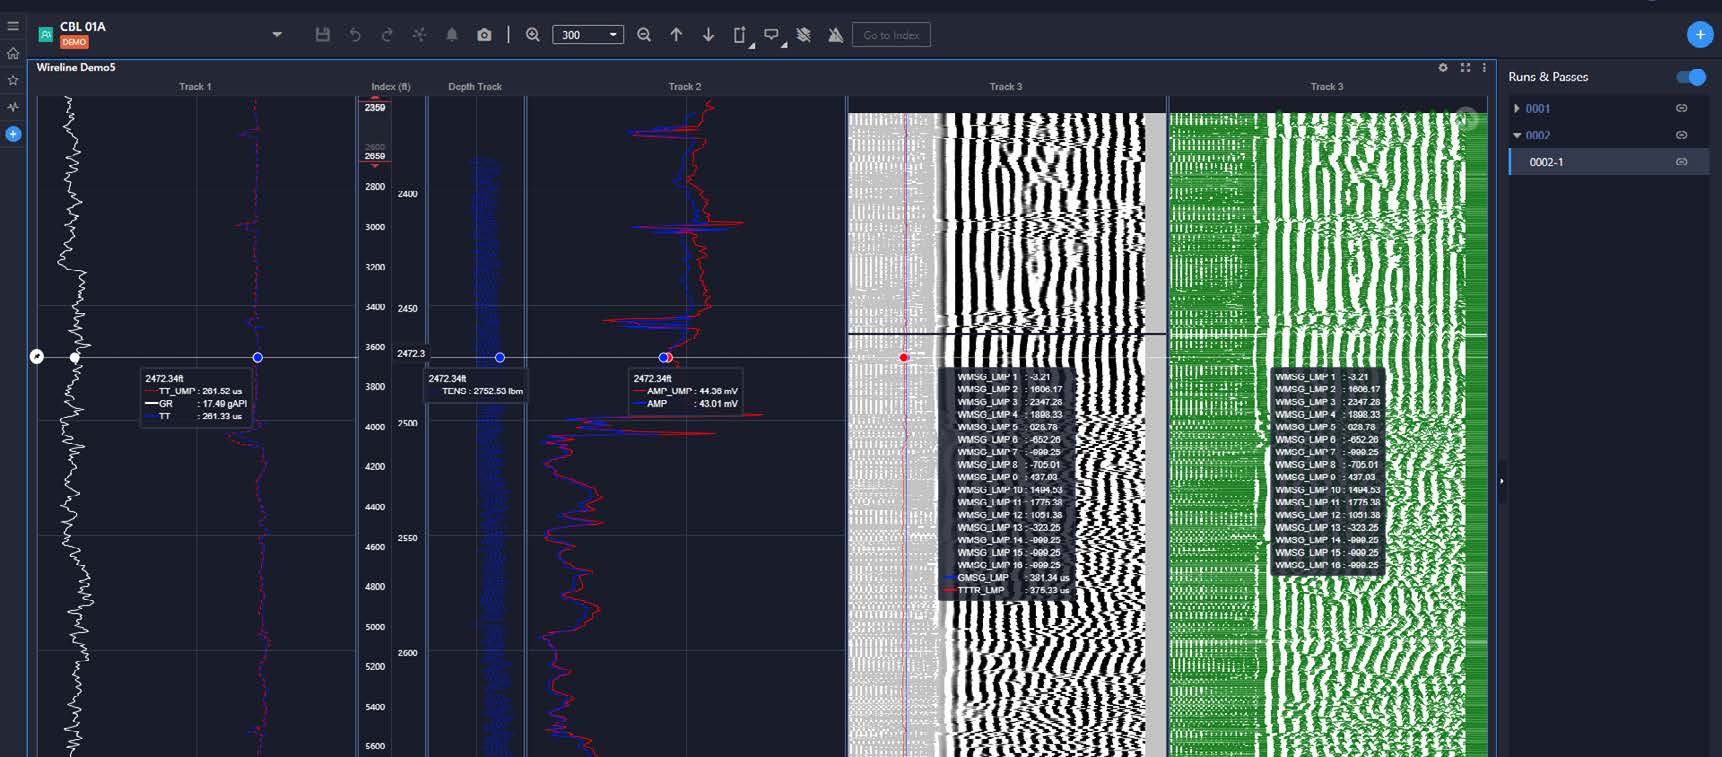
Cement Bond Log
The Cement Bond Logs (CBL) display equips completion engineers with real-time, visual insight into cement bond quality, enabling faster, more confident decisions to ensure zonal isolation. The collaborative, customizable web interface helps reduce remediation costs, prevent fluid migration, and ensure regulatory compliance — protecting well integrity across the entire well lifecycle.
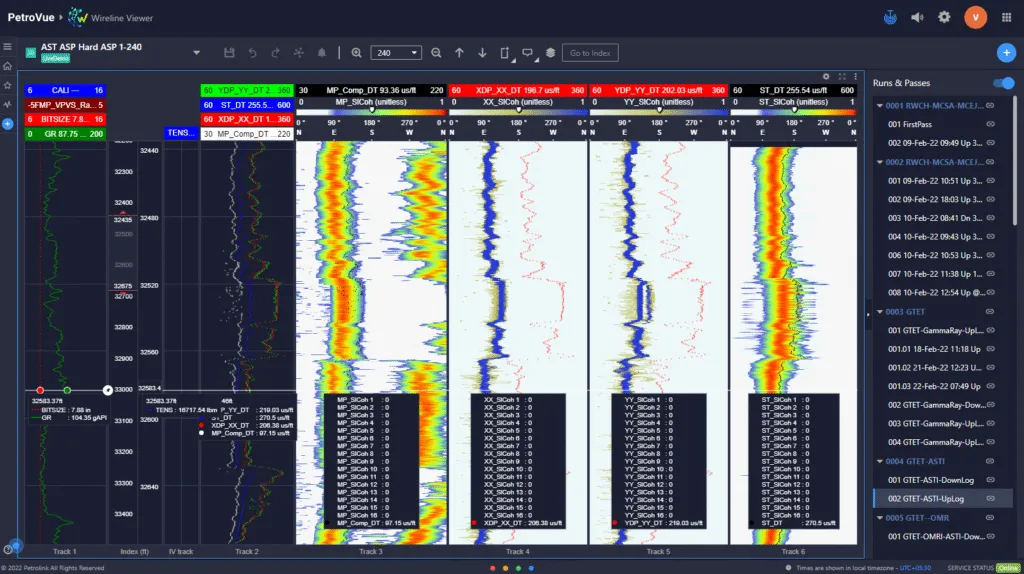
XPAD Imaging
The XPAD Imaging display provides high-resolution borehole wall images, giving geologists and engineers a detailed, depth-correlated view of subsurface structures. It enables precise identification of fractures, faults, and sedimentary features, while also evaluating borehole shape and stability. This insight supports faster, more informed decisions on well placement, optimized completions, and enhanced reservoir development.
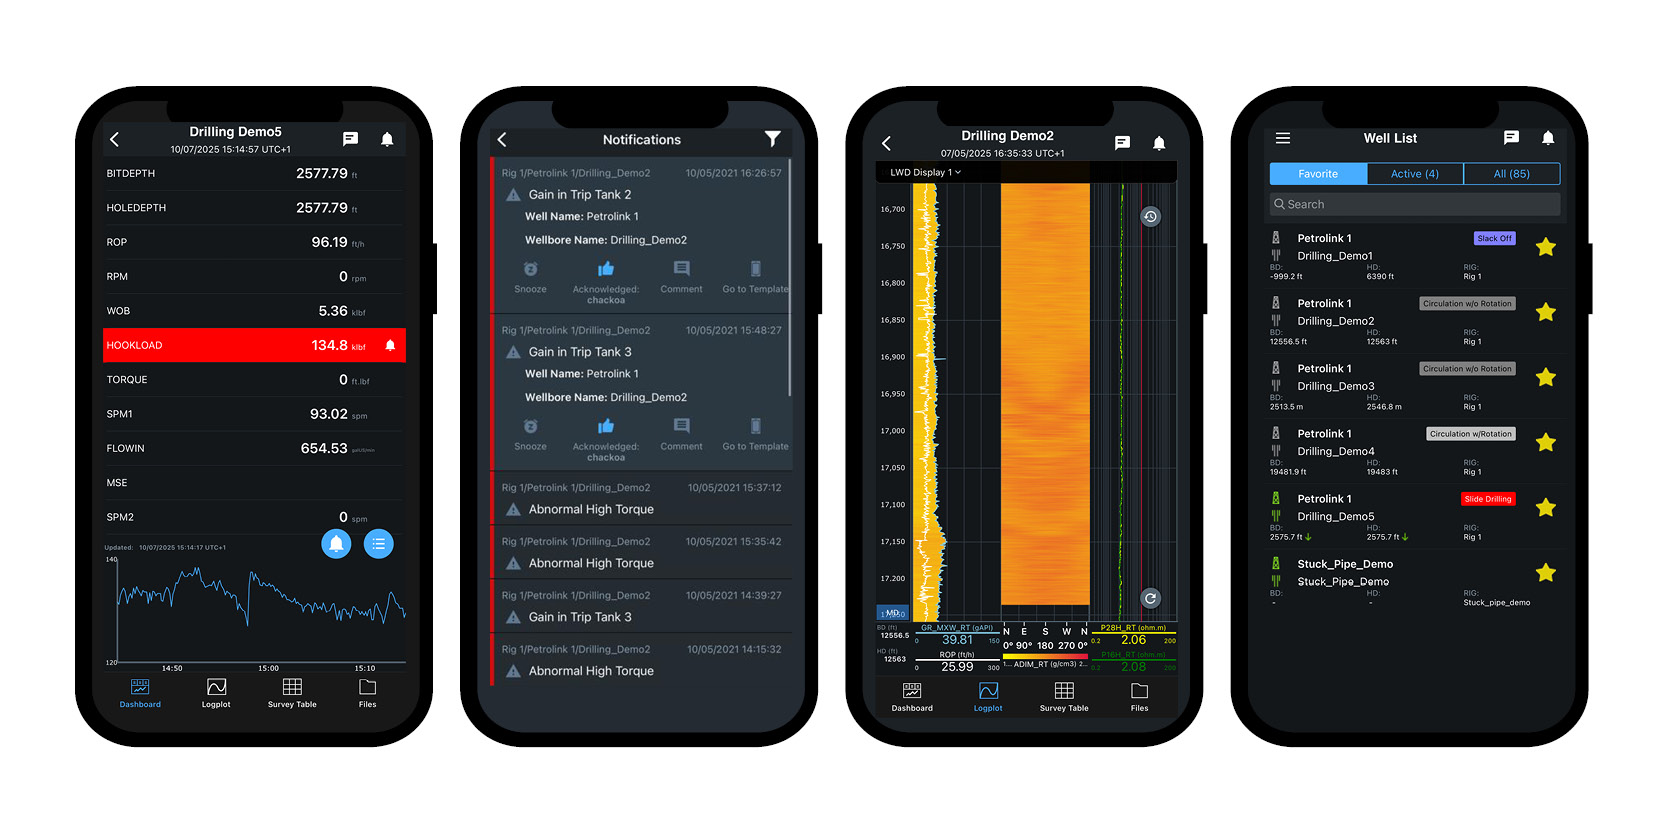


PetroVue Mobile ™
PetroVue Mobile gives engineers and subsurface teams real-time visibility into critical wellsite operations — anytime, anywhere. With fast, secure, mobile access to key data and alerts, PVM enables quick, informed decisions and proactive responses to operational risks, even when away from the rig. The lightweight design, mobile-optimized interface, and global connectivity ensure operational clarity is always within reach.
-
Track active and favorite wells on the go.
-
View key parameters in a customizable, user-friendly dashboard.
-
Monitor well trajectory with a dedicated survey table.
-
Receive instant notifications and smart alerts to stay informed and respond quickly.
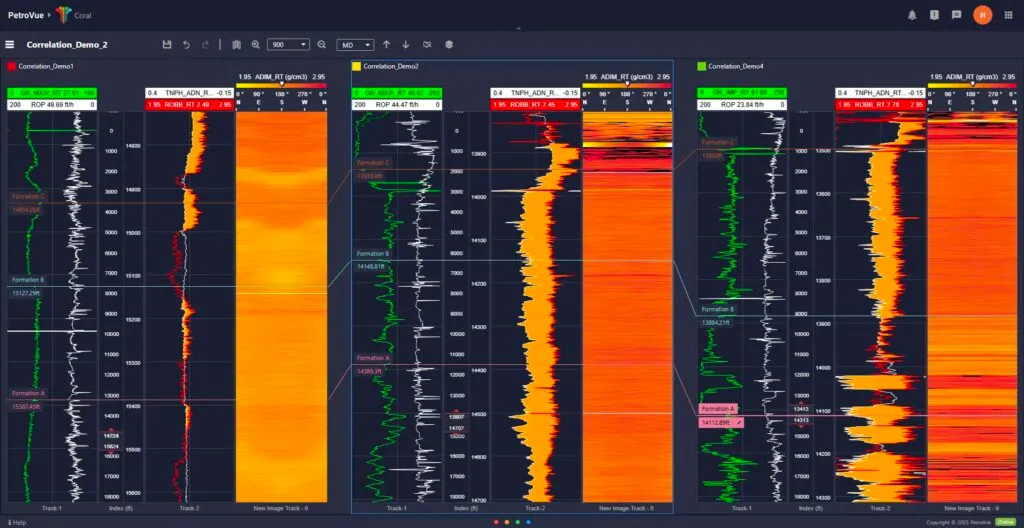
PetroVue Coral ™
Coral is a real-time well correlation tool that gives you a comprehensive subsurface view. It efficiently correlates live drilling data with offset wells. You can also integrate LWD data, lithology, structural insights, and borehole imagery from both active and historical wells. With features like formation top picking, curve ghosting, and enhanced cross-well analysis, Coral enables faster, more informed geological decisions.
-
Compare live drilling with offset and historical wells for real-time correlation.
-
Auto-calculate MD, TVD, and TVDSS for accurate formation top placement.
-
Use curve ghosting and customizable formation tops for precise formation picking.
-
Visualize structural, geographical, and borehole image data in one view.
-
Fully integrates with PetroVue for seamless workflows.
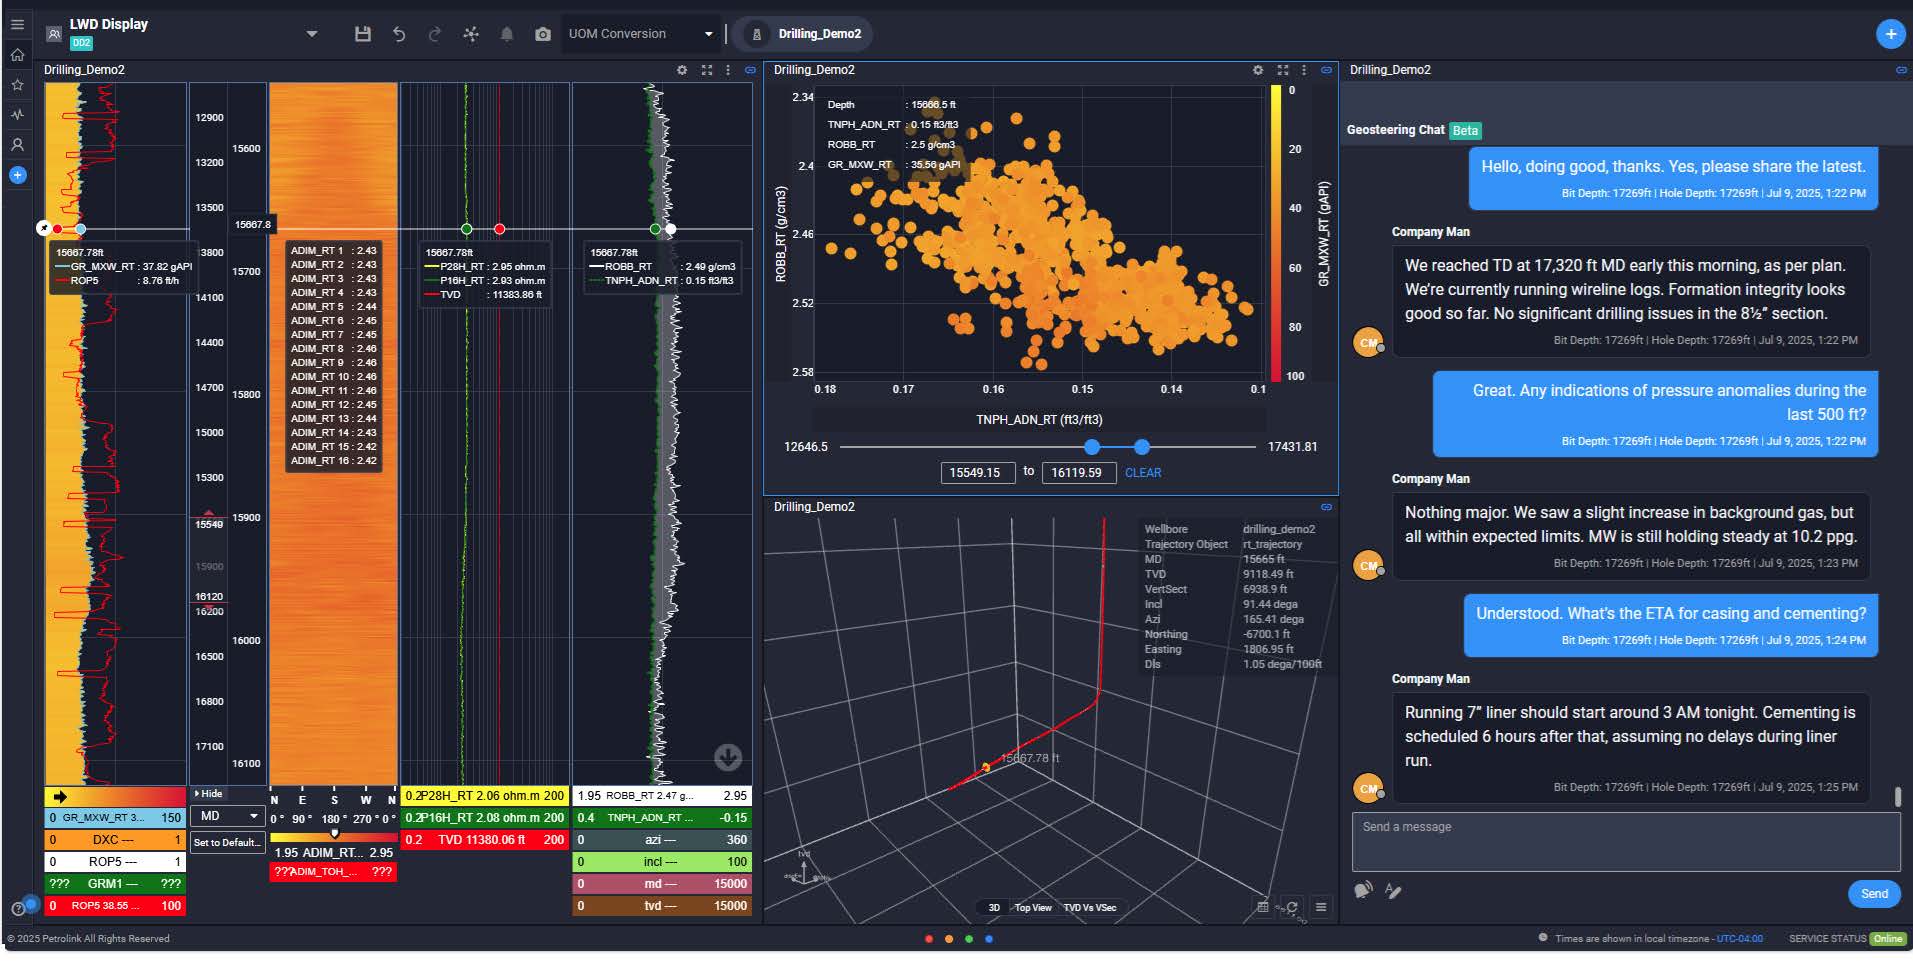
PetroVue RigChat ™
PetroVue RigChat is a secure, integrated communication tool designed to streamline collaboration and communication for faster supervision, monitoring, and decision-making across distributed teams. RigChat enables real-time information sharing, improved data validation, and greater operational oversight.
-
Integrated messaging enables real-time collaboration across teams and locations.
-
Share drilling updates, geological data, and more in rig-specific channels.
-
Export conversations for complete operational records.
-
Each message is aligned to a specific time and depth index, making it easy to correlate discussions with well activity.
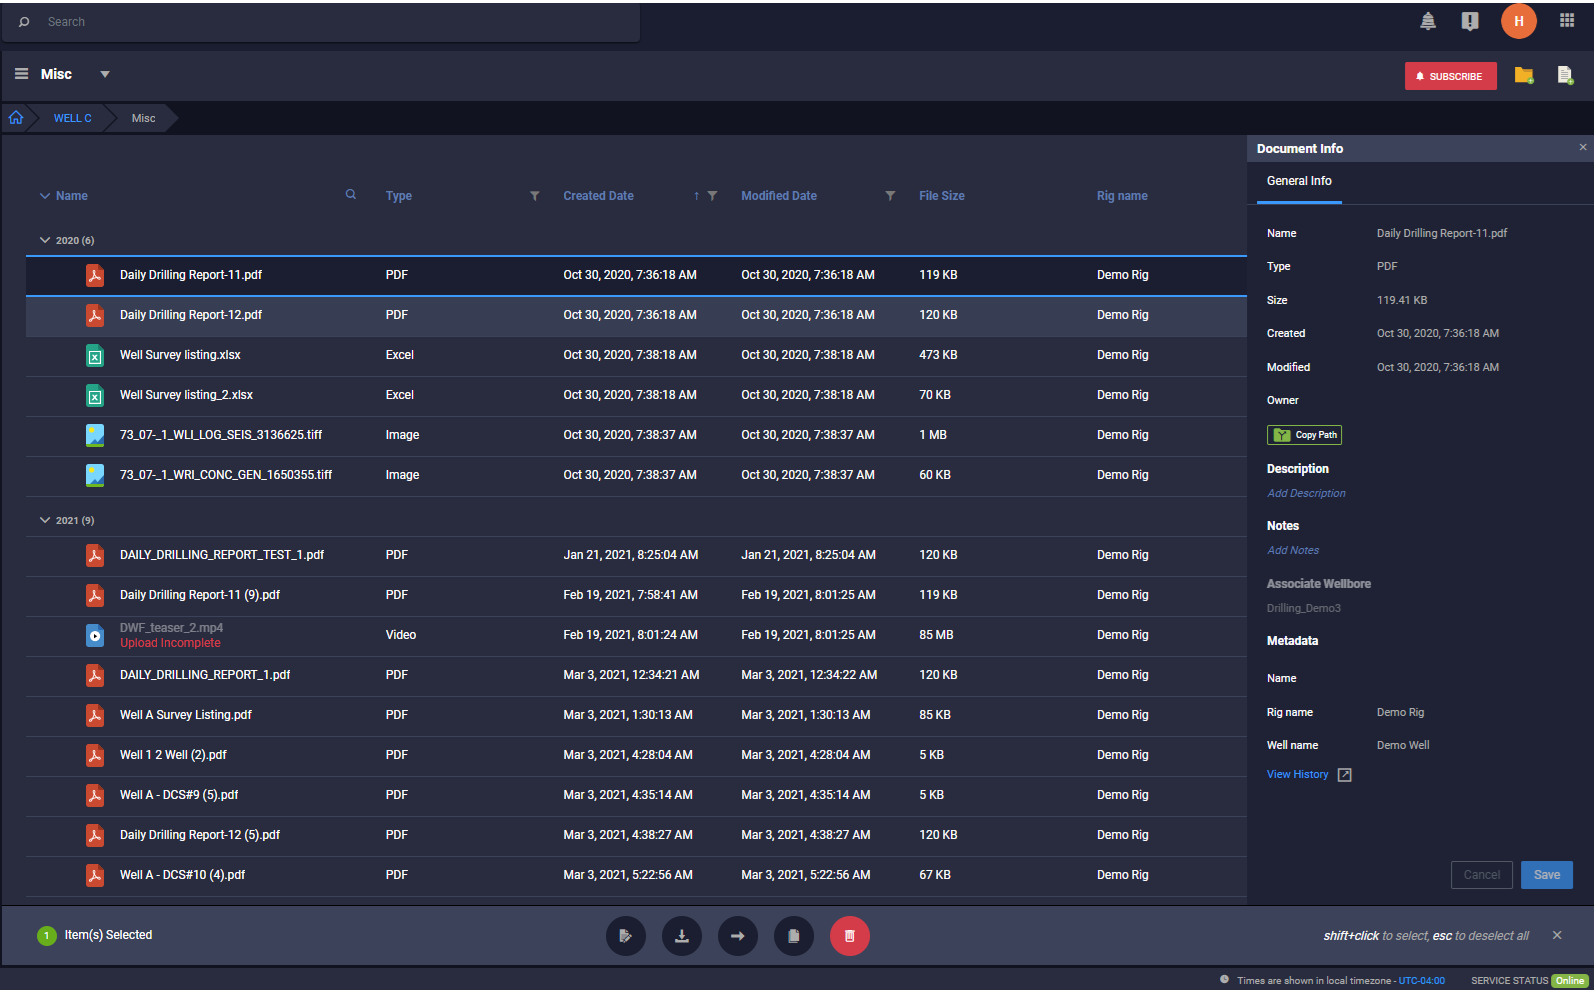
Digital Well File ™
Struggling with fragmented files, scattered wellsite reports, and version confusion?
Petrolink’s Digital Well File centralizes critical drilling and geological files in a secure system that has been custom-built for oilfield operations. Files shared through PetroVue are validated to ensure accuracy and consistency across teams, supporting reliable and aligned decision-making.
With smart alerts, naming conventions, and support for multiple file types, teams can confidently collaborate, track definitive versions, and make faster, insight-driven decisions.
-
Preview and manage files of all types in one place.
-
Organize data across wells, contractors, and consultants with powerful search functionalities and metadata tagging.
-
Secure personal storage with custom access controls and two-step verification.
-
Upload/download multiple files at once with format checks for consistency.
-
Automated file sharing ensures teams work from the same data.
-
Web-based with mobile app and cross-platform access.
-
Supports SFTP and direct email uploads.
-
Subscription-based alerts notify users of file changes in real-time.
Tech Specs
-
Compatible with PDF, Word, Excel, images, CSV, MP4, and LAS.
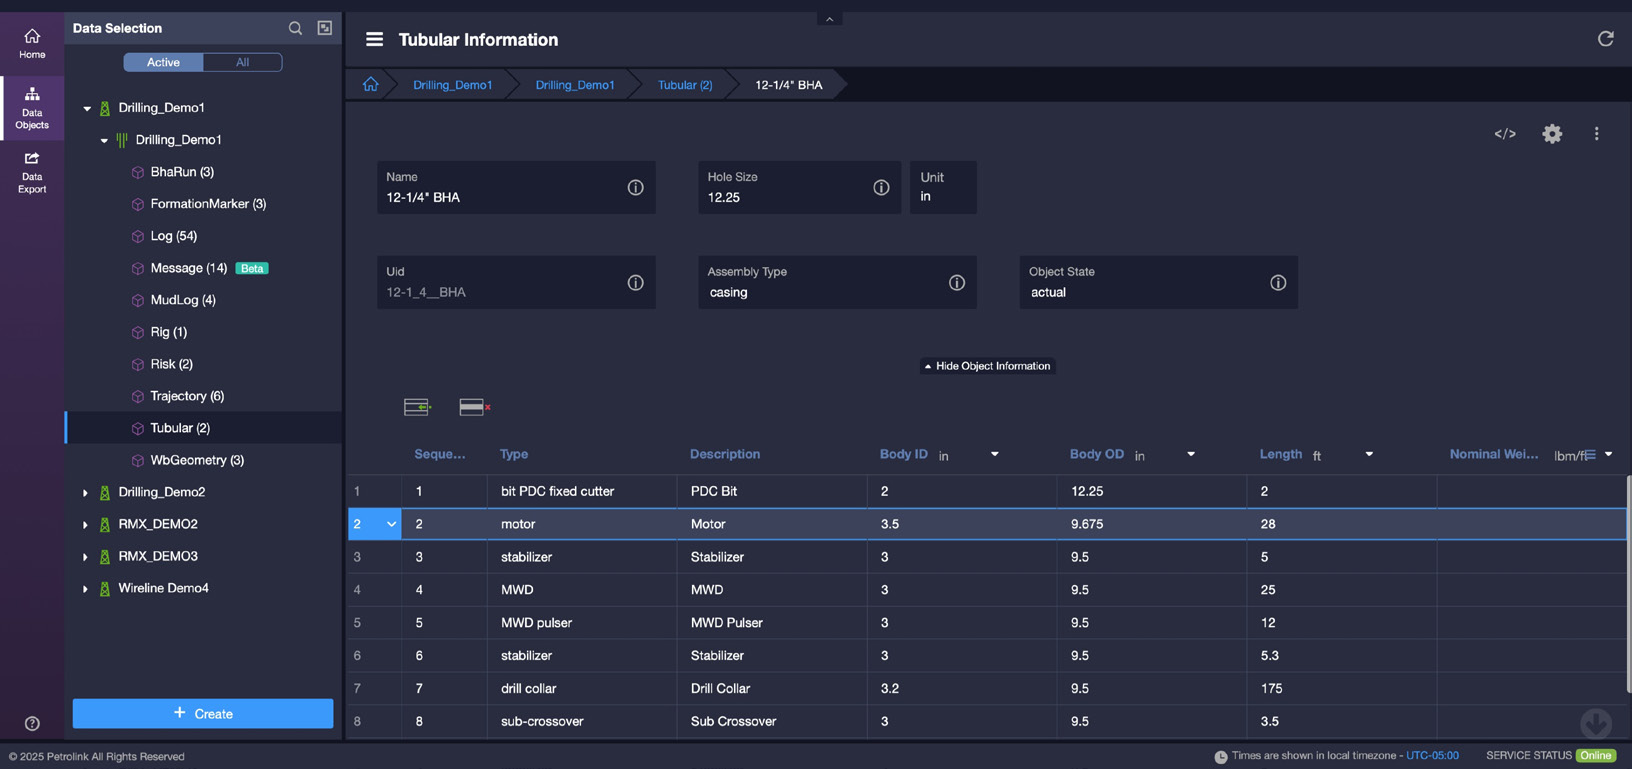
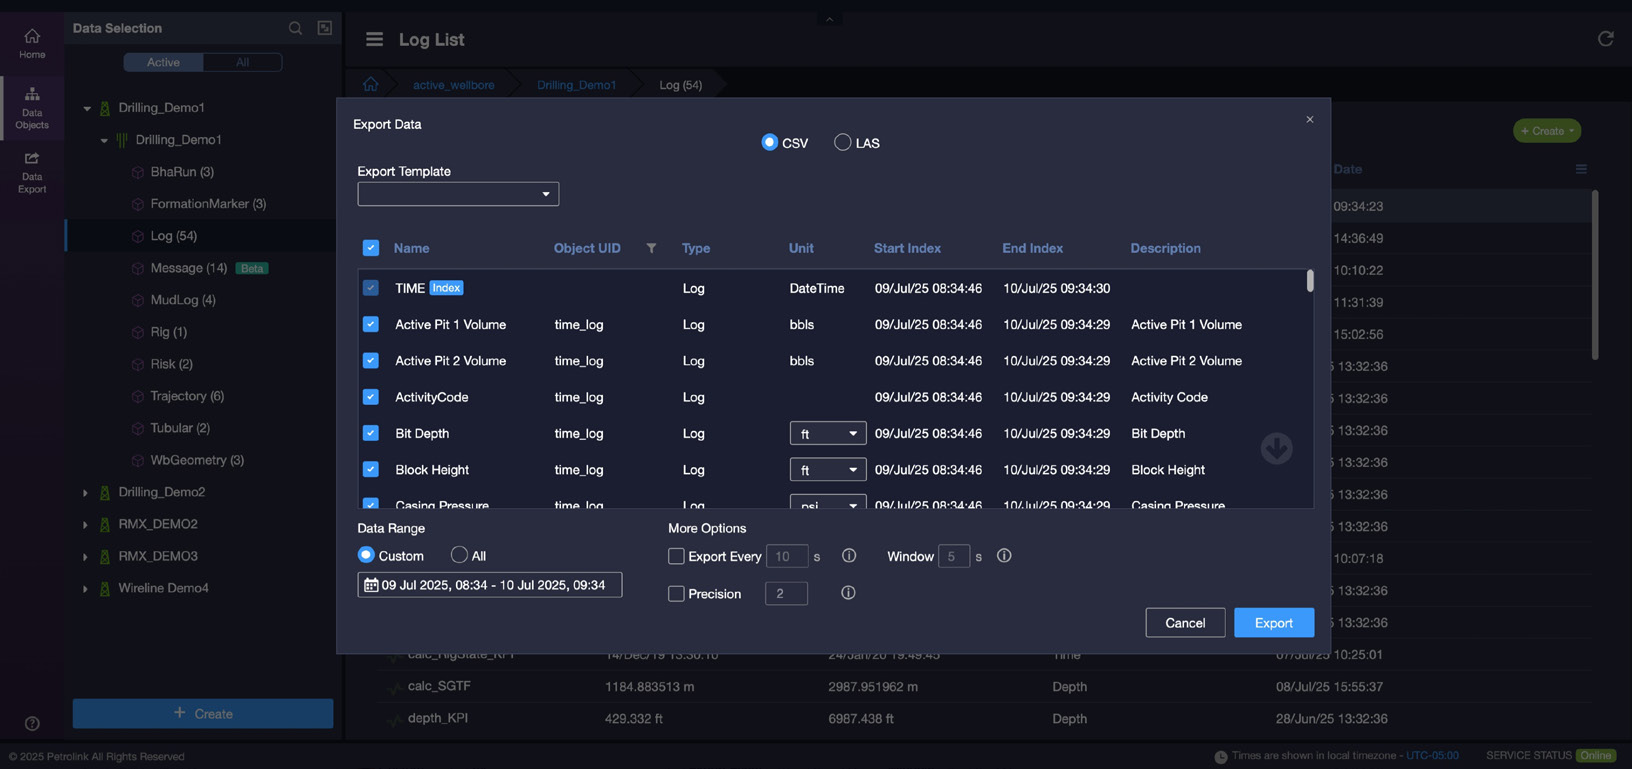
DataStudio ™
DataStudio transforms complex WITSML workflows into a fast,
intuitive web experience.
Say goodbye to clunky XML tools – just open your browser to easily manage and share wellsite data. Designed for data managers, geologists, and drilling engineers, DataStudio unifies global wellsite operations and accelerates collaboration, reducing delays and
enabling faster, more informed decisions.
-
Empowers users with self-service WITSML data discovery and management.
-
Create, edit, query, import and export data on a single, streamlined platform.
-
Create and manage virtual logs to standardise log and curve naming across projects to ensure consistency and discoverability.
-
Prioritize and splice curves when multiple curve sources are available.